CBSE (Central Board of Secondary Education) has always emphasised implementing knowledge in real-life problems. The majority of the students get scared even at the mention of the subject. The reason? The difficulty in grasping the concepts. These mathematical formulas seem like mindless terms put together, providing no meaning.
To help students understand these formulas with ease, the board has introduced the Maths Lab Manual with experimental activities for students. With the help of the practical activities in the Class 10 Math Lab Manual, students will be able to understand the fundamentals behind these formulas. Attempting these lab manual activities will also improve the performance in the board exams.
Lab Manual Class 10 Maths Syllabus & Practical List with Solutions
The lab manual activities constitute 12 marks in the final board examinations as part of the internal assessment. NCERT has provided free Class 10 Lab Manual activity PDFs in downloadable format for students as well as teachers.
As per the NCERT Class 10 Math activities list, 32 activities are included for the practical examinations.
To find the HCF of two numbers experimentally based on Euclid's Division Lemma.
Objective: To experimentally find the HCF of two numbers based on .
Material Required: Cardboard sheets, glazed papers of different colours, scissors, ruler, sketch pen, glue etc.
Method of Construction:
Cut out one strip of length a unit, one strip of length b units (b < a), two strips each of length c units (c < b), one strip of length d units (d < c) and two strips each of length e units (e < d) from the cardboard.
Cover these strips in different colours using glazed papers as shown in Fig. 1 to Fig. 5:
Stick these strips on the other cardboard sheet as shown in Fig. 6 to Fig. 9.
Demonstration:
As per Euclid's Division Lemma,
Fig. 6 depicts a = b × 1 + c (q = 1, r = c) (1)
Fig. 7 depicts b = c × 2 + d (q = 2, r = d) (2)
Fig.8 depicts c = d × 1 + e (q = 1, r = e) (3)
and Fig. 9 depicts d = e × 2 + 0 (q = 2, r = 0) (4)
As per assumptions in Euclid Division Algorithm,
HCF of a and b = HCF of b and c = HCF of c and d = HCF of d and e
The HCF of d and e is equal to e, from (4) above.
So, HCF of a and b = e.
Observation:
On actual measurement (in mm)
a =......... , b = ......... , c = ......... , d = ......... , e = .........
So, HCF of __________ and __________ = ......................
Application:
The process depicted can be used for finding the HCF of two or more numbers, which is known as finding the HCF of numbers by Division Method.
To draw the graph of a quadratic polynomial and observe:
(i) The shape of the curve when the coefficient of x2 is positive.
(ii) The shape of the curve when the coefficient of x2 is negative.
(iii) Its number of zeroes.
Objective: To draw the graph of a quadratic polynomial and observe: (i) The shape of the curve when the coefficient of x2 is positive. (ii) The shape of the curve when the coefficient of x2 is negative.(iii) Its number of zeroes.
To verify the conditions of consistency/ inconsistency for a pair of linear equations in two variables by graphical method.
Objective: To verify the conditions of consistency/inconsistency for a pair of linear equations in two variables by graphical method.
Material Required: Graph paper, pencil, eraser, cardboard, glue.
Method of Construction:
Take a pair of linear equations in two variables of the form
a1x + b1y + c1 = 0 (1)
a2x + b2y + c2 = 0, (2)
where a1, b1, a2, b2, c1 and c2 are all real numbers; a1, b1, a2 and b2 are not simultaneously zero.
There may be three cases :
Case I:
Case II:
Case III:
Obtain the ordered pairs satisfying the pair of linear equations (1) and (2) for each of the above cases.
Take a cardboard of a convenient size and paste a graph paper on it. Draw two perpendicular lines X’OX and YOY’ on the graph paper (see Fig. 1). Plot the points obtained in Step 2 on different cartesian planes to obtain different graphs [see Fig. 1, Fig. 2 and Fig.3].
Demonstration:
Case I: We obtain the graph as shown in Fig. 1. The two lines intersect at one point P. Co-ordinates of the point P (x,y) give the unique solution for the pair of linear equations (1) and (2).
Therefore, the pair of linear equations with a1/a2 ≠ b1/b2is consistent and has a unique solution.
Case II: We obtain the graph as shown in Fig. 2. The two lines are coincident. Thus, the pair of linear equations has infinitely many solutions.
Therefore, the pair of linear equations with a1/a2 = b1/b2= c1/c2 is also consistent as well as dependent.
Case III: We obtain the graph as shown in Fig. 3. The two lines are parallel to each other. This pair of equations has no solution, i.e., the pair of equations with a1/a2 = b1/b2≠c1/c2 is inconsistent.
Observation:
a1 = __________, a2 = __________,
b1 = __________, b2 = __________,
c1 = __________, c2 = __________,
So, a1/a2 = ...................,
b1/b2= ...................,
c1/c2= ...................,
Application:
Conditions of consistency help to check whether a pair of linear equations has a solution (s) or not.
In case, solutions/solutions exist/exist, to find whether the solution is unique or the solutions are infinitely many.
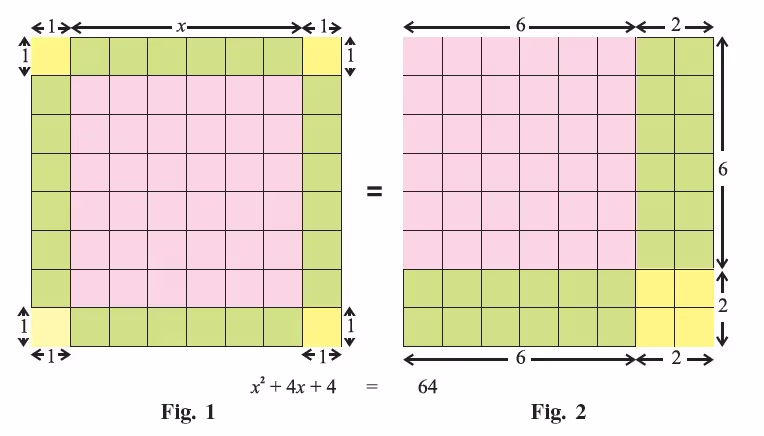
To obtain the solution of a quadratic equation (x2 + 4x = 60) by completing the square geometrically.
Objective: To obtain the solution of a quadratic equation (x2 + 4x = 60) by completing the square geometrically.
Material Required: Hardboard, glazed papers, adhesive, scissors, marker, white chart paper.
Method of Construction:
Take a hardboard of a convenient size and paste a white chart paper on it.
Draw a square of side of length x units, on a pink glazed paper and paste it on the hardboard [see Fig. 1] . Divide it into 36 unit squares with a marker.
Along with each side of the square (outside) paste rectangles of green glazed paper of dimensions x × 1, i.e., 6 × 1 and divide each of them into unit squares with the help of a marker [see Fig. 1].
Draw 4 squares each of side 1 unit on a yellow glazed paper, cut them out and paste each unit square on each corner as shown in Fig. 1.
Draw another square of dimensions 8 × 8 and arrange the above 64 unit squares as shown in Fig. 2.
Demonstration:
The first square represents the total area x2 + 4x + 4.
The second square represents a total of 64 (60 + 4) unit squares.
Thus, x2 + 4x + 4 = 64or (x + 2)2 = (8)2 or (x + 2) = ±8 i.e., x = 6 or x = –10Since x represents the length of the square, we cannot take x = –10 in this case, though it is also a solution.
Observation
Take various quadratic equations and make the squares as described above, solve them and obtain the solution(s).
Application
Quadratic equations are useful in understanding the parabolic paths of projectiles projected in space in any direction.
To identify Arithmetic Progressions in some given lists of numbers (patterns).
Objective: To identify Arithmetic Progressions in some given lists of numbers (patterns).
Material Required: Cardboard, white paper, pen/pencil, scissors, squared paper, glue.
Method of Construction:
Take a cardboard of a convenient size and paste a white paper on it.
Take two squared pieces of paper (graph paper) of suitable size and paste them on the cardboard.
Let the lists of numbers be
(i) 1, 2, 5, 9, ....... (ii) 1, 4, 7, 10, ......
Make strips of lengths 1, 2, 5, and 9 units and strips of lengths 1, 4, 7, and 10 units and the breadth of each strip one unit.
Paste the strips of lengths 1, 2, 5, and 9 units as shown in Fig. 1 and paste the strips of lengths 1, 4, 7, and 10 units as shown in Fig. 2.
Demonstration:
In Fig. 1, the difference in heights (lengths) of two consecutive strips is not the same (uniform). So, it is not an AP.
In Fig. 2, the difference in heights of two consecutive strips is the same (uniform) throughout. So, it is an AP.
Observation:
In Fig. 1, the difference in heights of the first two strips = _____________
the difference of heights of second and third strips = _____________
the difference in heights of the third and fourth strips = _____________
Difference is _____________ (uniform/not uniform)
So, the list of numbers 1, 2, 5, 9 _____________ form an AP. (does/does not)
Write the similar observations for strips of Fig.2.
Difference is _____________ (uniform/not uniform)
So, the list of the numbers 1, 4, 7, 10 _________ form an AP. (does/does not)
Application:
This activity helps in understanding the concept of arithmetic progression.
Note:
Observe that if the left top corners of the strips are joined, they will be in a straight line in case of an AP.
To find the sum of first n natural numbers.
Objective: To find the sum of the first n natural numbers.
Material Required: Cardboard, coloured papers, white paper, cutter, adhesive.
Method of Construction:
Take a rectangular cardboard of a convenient size and paste coloured paper on it. Draw a rectangle ABCD of length 11 units and breadth 10 units.
Divide this rectangle into unit squares as shown in Fig. 1.
Starting from the upper left-most corner, colour one square, 2 squares and so on as shown in the figure.
Demonstration:
The pink colour region looks like a staircase.
The length of the 1st stair is 1 unit, the length of the 2nd stair is 2 units, the length of the 3rd stair is 3 units, and so on, the length of the 10th stair is 10 units.
These lengths give a pattern 1, 2, 3, 4, ..., 10, which is an AP with first term 1 and common difference 1.
The sum of first ten terms = 1 + 2 + 3 + ... +10 = 55 (1)
Area of the shaded region = ½ (area of rectangle ABCD) = ½ x 10x 11,
which is the same as obtained in (1) above.
This shows that the sum of the first 10 natural numbers is = ½ x 10x 11= ½ x 10 (10+1).This can be generalised to find the sum of first n natural numbers as Sn = ½ n (n+1) (2)
Observation:
For n = 4, Sn = ..............................
For n = 12, Sn = ..............................
For n = 50, Sn = ..............................
For n = 100, Sn = .............................
Application:
Result (2) may be used to find the sum of the first n terms of the list of numbers:
12, 22, 32, …
13, 23, 33, ...
to be studied in Class XI.
To find the sum of the first n odd natural numbers.
Objective: To find the sum of the first n odd natural numbers.
Take a piece of cardboard of a convenient size and paste a white paper on it.
Draw a rectangle of suitable size on it (10 cm × 11 cm).
Divide this rectangle into unit squares.
Fix a thermocol ball in each square using a pin as shown in Fig. 1.
Enclose the balls as shown in the figure.
Demonstration:
Starting from the uppermost left corner,
the number of balls in first enclosure = 2 ( = 1 ×2),
the number of balls in first two enclosures = 2 + 4 = 6 ( = 2 ×3),
the number of balls in first three enclosures = 2 + 4 + 6 = 12 ( = 3 ×4),
:
the number of balls in first six enclosures = 2 + 4 + 6 + 8 + 10 + 12 = 42 (= 6 × 7)
the number of balls in first ten enclosures = 2 +4 + 6 + 8 + ... + 20 = 110 (=10 × 11)
This gives the sum of the first ten even natural numbers.
This result can be generalised for the sum of first n even natural numbers as
Sn = 2 + 4 + 6 + ... + 2n = n × (n + 1) (1)
Observation:
For n = 4 in (1), Sn = ........................
For n = 7 in (1), Sn = ........................
For n = 40 in (1), Sn = ........................
For n = 70 in (1), Sn = ........................
For n = 100 in (1), Sn= ........................
Application:
The formula Sn = n (n+1) is useful in finding out the sum of the first n even numbers.
To establish a formula for the sum of the first n terms of an Arithmetic Progression.
Objective: To establish a formula for the sum of the first n terms of an Arithmetic Progression.
Material Required: Cardboard, coloured drawing sheets, white paper, cutter, adhesive.
Method of Construction:
Take a rectangular cardboard of a convenient size and paste a white paper on it. Draw a rectangle ABCD of length (2a+9d) units and breadth 10 units.
Make some rectangular strips of equal length a unit and breadth one unit and some strips of length d units and breadth 1 unit, using coloured drawing sheets.
Arrange/paste these strips on the rectangle ABCD as shown in Fig. 1.
Demonstration:
The strips so arranged look like a staircase.
The first stair is of length a unit, the second stair is of length a+d (units), the third of a+2d units and so on and each is of breadth 1 unit. So, the areas (in sq. units) of these strips are a, a + d, a + 2d, ....., a+9d, respectively.
This arrangement of strips gives a pattern a, a + d, a + 2d, a + 3d, … which is an AP with first term a and the common difference d.
The sum of the areas (in square units) of these strips = a + (a + d) + (a + 2d) + ... + (a + 9d) = 10a + 45d (1)
Area of the design formed by the staircase = ½ (area of rectangle ABCD) = ½ (10) (2a+9d)
= (10a + 45d), which is the same as obtained in (1) above.
This shows that the sum of the first 10 terms of the AP = ½ (10) (2a+9d)
= ½ (10) [(2a+(10 -1)d)
This can be further generalised to find the sum of the first n terms of an AP as Sn = n/2 [(2a+(n -1)d)
Observation:
On actual measurement:
a = ---------, d = -----------, n = --------- Sn = ------------
Sn = n/2 [-+(n -1)-)
Application:
This result may be used to find the sum of the first n terms of the list of numbers :
Take cardboard of convenient size and paste a chart paper on it [see Fig. 1].
Paste a graph paper on the chart paper.
Draw the axes X’OX and Y’OY on the graph paper [see Fig. 1].
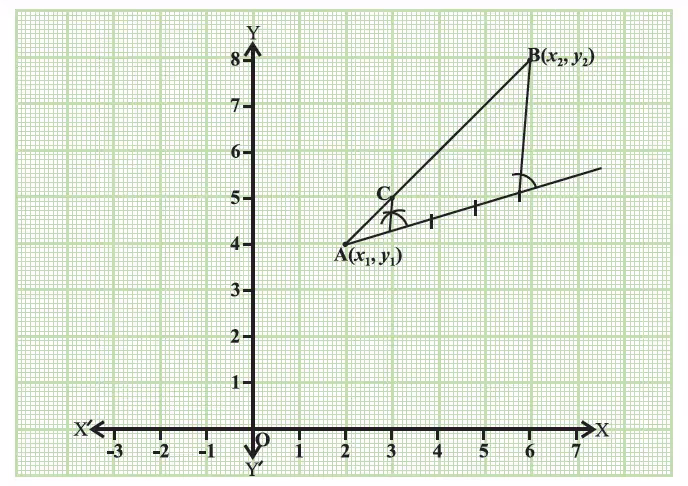
Take three points A(x1,y1), B(x2,y2) and C(x3,y3) on the graph paper.
Join the points to get a triangle ABC [see Fig. 2].
Demonstration
Calculate the area of the triangle ABC using the formula:
Area = ½ [x1 (y2-y3) +x2 (y3-y1) + x3 (y1-y2)]
Find the area of the triangle ABC by counting the number of squares enclose in it in the following way:
(i) Take a complete square as 1
(iii) take more than half a square as 1
(iii) take half a square as ½.
(iv) ignore the squares which are less than half a square.
The area calculated from the formula and by actually counting the squares is nearly the same [see steps 1 and 2].
Observation:
Coordinates of A are _______________.
Coordinates of B are _______________.
Coordinates of C are _______________.
Area of DABC by using formula = ______________.
(i) Number of complete squares = ______________.
(ii) Number of more than half squares = ___________.
(iii) Number of half squares = ______________.
(iv) Total area by counting the squares = ______________.
Area calculated by using the formula and by counting the number of squares are _____________.
Application:
The formula for the area of the triangle is useful in various results in geometry such as checking the collinearity of three points, and calculating the area of a triangle/ quadrilateral/polygon.
Take a coloured paper/chart paper. Cut out two triangles ABC and PQR with their corresponding angles equal.
In the triangles ABC and PQR, ∠A =∠P; ∠B = ∠Q and ∠C = ∠R.
Place the △ABC on △PQR such that vertex A falls on vertex P and side AB falls along side PQ (side AC falls alongside PR) as shown in Fig. 2.
Demonstration I
In Fig. 2, ∠B = ∠Q. Since corresponding angles are equal, BC||QR
By BPT, PB/PQ = PC/CR or AB/BQ = AC/CR or BQ/AB = CR/AC
or (BQ + AB)/AB = (CR + AC)/AC [Adding 1 to both sides]
or AQ/AB = AR/AC or PQ/AB = PR/AC or AB/PQ = AC/PR (1)
II
Place the △ABC on △PQR such that vertex B falls on vertex Q, and side BA falls along side QP (side BC falls along side QR) as shown in Fig. 3.
Demonstration II
In Fig. 3, ∠C = ∠R. Since corresponding angles are equal, AC||PR
By BPT, AP/AB = CR/BC or BP/AB = BR/BC or BQ/AB = CR/AC [Adding 1 on both sides]
or PQ/PB = QR/BC or AB/PQ = BC/QR (2)
From (1) and (2), AB/PQ = AC/PR = BC/QR
Thus, from Demonstrations I and II, we find that when the corresponding angles of two triangles are equal, then their corresponding sides are proportional. Hence, the two triangles are similar. This is the AAA criterion for the similarity of triangles.
Alternatively, you could have measured the sides of the triangles ABC and PQR and obtained
AB/PQ = AC/PR = BC/QR
From this result, △ABC and △PQR are similar, i.e., if three corresponding angles are equal, the corresponding sides are proportional and hence the triangles are similar. This gives the AAA criterion for the similarity of two triangles.
III
Take a coloured paper/chart paper, and cut out two triangles ABC and PQR with their corresponding sides proportional.
i.e. AB/PQ = BC/QR = AC/PR
Place the △ABC on △PQR such that vertex A falls on vertex P and side AB falls along side PQ. Observe that side AC falls along side PR [see Fig. 4].
Demonstration III
In Fig. 4, AB/PQ = AC/PR. This gives AB/BQ = AC/CR. So, BC||QR (by the converse of BPT).
i.e., ∠B = ∠Q and ∠C = ∠R. Also ∠A = ∠P. That is, the corresponding angles of the two triangles are equal.Thus, when the corresponding sides of two triangles are proportional, their corresponding angles are equal. Hence, the two triangles are similar. This is the SSS criterion for the similarity of two triangles.
Alternatively, you could have measured the angles of △ABC and △PQR and obtained ∠A = ∠P, ∠B = ∠Q and ∠C = ∠R.From this result,△ABC and △PQR are similar, i.e., if three corresponding sides of two triangles are proportional, the corresponding angles are equal, and hence the triangles are similar. This gives the SSS criterion for the similarity of two triangles.
IV
Take a coloured paper/chart paper, and cut out two triangles ABC and PQR such that their one pair of sides is proportional and the angles included between the pair of sides are equal.
i.e., In △ABC and △PQR, AB/PQ = AC/PR and ∠A = ∠P.
Place triangle ABC on triangle PQR such that vertex A falls on vertex P and side AB falls along side PQ as shown in Fig. 5.
Demonstration IV
In Fig. 5, AB/PQ = AC/PR. This gives AB/PQ = AC/PR. So, BC||QR (by the converse of BPT). Therefore, ∠B = ∠Q and ∠C = ∠R.
From this demonstration, we find that when two sides of one triangle are proportional to two sides of another triangle and the angles included between the two pairs of sides are equal, then the corresponding angles of two triangles are equal.
Hence, the two triangles are similar. This is the SAS criterion for the similarity of two triangles.
Alternatively, you could have measured the remaining sides and angles of △ABC and △PQR and obtained ∠B = ∠Q, ∠C = ∠R and AB/PQ = AC/PR = BC/QR
From this, △ABC and △PQR are similar and hence we obtain the SAS criterion for the similarity of two triangles.
If two sides of one triangle are ______ to the two sides of other triangle and angles included between them are _______, then the triangles are _______.
Application:
The concept of similarity is useful in reducing or enlarging images or pictures of objects.
To draw a system of similar squares, using two intersecting strips with nails.
Objective: To draw a system of similar squares, using two intersecting strips with nails.
Material Required: Two wooden strips (each of size 1 cm wide and 30 cm long), adhesive, hammer, and nails.
Method of Construction:
Take two wooden strips say AB and CD.
Join both the strips intersecting each other at right angles at point O [see Fig. 1].
Fix five nails at equal distances on each of the strips (on both sides of O) and name them, say A1, A2, ......., A5, B1, B2, ......., B5, C1, C2, ......., C5 and D1, D2, ......., D5 [see Fig. 2].
Wind the thread around the nails of subscript 1 (A1C1B1D1) on four ends of two strips to get a square [see Fig. 3].
Similarly, wind the thread around nails of the same subscript on respective strips [see Fig. 3]. We get squares A1C1B1D1 , A2C2B2D2, A3C3B3D3, A4C4 B4 D4 and A5C5B5D5.
Demonstration
On each of the strips AB and CD, nails are positioned equidistant to each other, such that
Therefore, square A2C2B2D2 and square A4C4B4D4 are ________. Similarly, each square is ______ to the other squares.
Application:
The concept of similarity can be used in the enlargement or reduction of images like maps in an atlas and also in making photographs of different sizes from the same negative.
Precautions:
Care should be taken while using nails and hammers.
Nails should be fixed at equal distances.
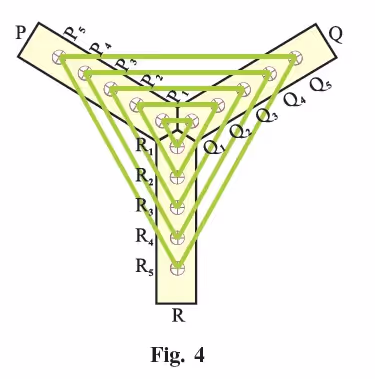
To draw a system of similar triangles, using Y-shaped strips with nails.
Objective: To draw a system of similar triangles, using Y-shaped strips with nails.
Material Required: Three wooden strips of equal lengths (approx. 10 cm long and 1 cm wide), adhesive, nails, cello tape, and hammer.
Method of Construction:
Take three wooden strips say P, Q, R and cut one end of each strip [see Fig. 1]. Using adhesive/tape, join three ends of each strip such that they all lie in different directions [see Fig. 1].
Fix five nails at equal distances on each of the strips and name them P1, P2, ..., P5, Q1, Q2, ..., Q5 and R1, R2, ..., R5 on strips P, Q and R, respectively [see Fig. 2].
Wind the thread around the nails of subscript 1 (P1, Q1, R1) on three respective strips [see Fig. 3].
To get more triangles, wind the thread around the nails of the same subscript on the respective strips. We get triangles P1Q1R1, P2Q2R2, P3Q3R3, P4Q4R4 and P5Q5R5 [see Fig. 4].
Demonstration
Three wooden strips are fixed at some particular angles.
On each of the strips P, Q, and R, nails are positioned at equal distances such that P1P2=P2P3=P3P4=P4P5 on strip P and similarly Q1Q2=Q2Q3=Q3Q4=Q4Q5 and R1R2=R2R3=R3R4=R4R5 on strip Q and R, respectively.
Now take any two triangles say P1Q1R1 and P5Q5R5. Measure the sides P1Q1, P5Q5, P1R1, P5R5, R1Q1 and R5Q5.
Find the ratios P1Q1 /P5Q5 , P1R1/P5R5 , R1Q1/R5Q5
Observe that P1Q1 /P5Q5 =P1R1/P5R5 =R1Q1/R5Q5
Thus, △P1Q1R ~ P5Q5R5 (SSS similarity criterion)
It can be easily shown that any two triangles formed on Y-shaped strips are similar.
The concept of similarity can be used in reducing or enlarging images (like maps in atlas) and also in making photographs of different sizes from the same negative.
Using the concept of similarity, unknown dimensions of an object can be determined using a similar object with known dimensions.
Using the concept of similarity and length of the shadow of the pole in sunlight, the height of a pole can be found.
Note:
By winding a thread at suitable nails, we can obtain non-equilateral similar triangles also.
To verify the Basic Proportionality Theorem (Thales theorem)
Objective: To verify the Basic Proportionality Theorem (Thales theorem).
Material Required: Two wooden strips (each of size 1 cm wide and 30 cm long), cutter, adhesive, hammer, nails, bard board, white paper, pulleys, thread, scale and screw etc.
Method of Construction:
Cut a piece of hardboard of a convenient size and paste a white paper on it.
Take two thin wooden strips with markings 1, 2, 3, ... at equal distances and fix them vertically on the two ends of the horizontal strip as shown in Fig. 1 and call them AC and BD.
Cut a triangular piece of PQR from the hardboard (thickness should be negligible) and paste coloured glazed paper on it and place it between the parallel strips AC and BD such that its base QR is parallel to the horizontal strip AB as drawn in Fig. 1.
Graduate the other two sides of the triangular piece as shown in the figure.
Put the screws along the horizontal strip and two more screws on the top of the board at the points C and D such that A, B, D and C become four vertices of a rectangle.
Take a ruler (scale) and make four holes on it as shown in the figure and fix four pulleys at these holes with the help of screws.
Fix the scale on the board using the thread tied to nails fixed at points A, B, C and D passing through the pulleys as shown in the figure, so that the scale slides parallel to the horizontal strip AB and can be moved up and down over the triangular piece freely.
Demonstration
Set the scale on vertical strips parallel to the base QR of D PQR, say at points E and F. Measure the distances PE and EQ and also measure the distance PF and FR. It can be easily verified that
This verifies the Basic Proportionality Theorem (Thales theorem).
Repeat the activity as stated above, sliding the scale up and down parallel to the base of the triangle PQR and verifying the Thales theorem for different positions of the scales.
Observation:
By actual measurement:
PE = ___________, PF = ___________, EQ = ___________,
FR = ___________
PE/EQ = _______, PF/FR = ___________
Thus, PE/EQ = PF/FR. It verifies the Theorem.
Application:
The theorem can be used to establish various criteria for the similarity of triangles. It can also be used for constructing a polygon similar to a given polygon with a given scale factor.
To find the relationship between areas and sides of similar triangles
Objective: To find the relationship between areas and sides of similar triangles.
Material Required: Coloured papers, glue, geometry box, scissors/cutters, white paper.
Method of Construction:
Take a coloured paper of size 15 cm × 15 cm.
On white paper, draw a triangle ABC.
Divide the side AB of DABC into some equal parts [say 4 parts].
Through the points of division, draw line segments parallel to BC and through points of division of AC, draw line segments parallel to AB [see Fig. 1].
Paste the triangle on the coloured paper.
ΔABC is divided into 16 congruent triangles [see Fig. 1].
Demonstration
ΔAFH contains 4 congruent triangles, with base FH = 2DE.
ΔAIL contains 9 congruent triangles, with base IL = 3 DE = 3/2 FH.
In ΔABC, base BC = 4DE = 2 FH= 4/3 IL.
ΔADE ~ ΔAFH ~ΔAIL ~ ΔABC
Therefore, areas of similar triangles are proportional to ratio of the squares of their corresponding sides.
Observation:
By actual measurement:
BC = ______________, IL = ______________, FH = ______________,DE = ______________.Let the area of ΔADE be 1 sq. unit. Then
which shows that the ratio of the areas of similar triangles is ______ to the ratio of the squares of their corresponding sides.
Application:
This result is useful in comparing the areas of two similar figures.
To verify experimentally that the ratio of the areas of two similar triangles is equal to the ratio of the squares of their corresponding sides.
Objective: To verify experimentally that the ratio of the areas of two similar triangles is equal to the ratio of the squares of their corresponding sides.
Material Required: Coloured papers, geometry box, sketch pen, white paper, cardboard.
Method of Construction:
Take a cardboard of a convenient size and paste a white paper on it.
Make a triangle (equilateral) on a coloured paper of side x units and cut it out [see Fig. 1]. Call it a unit triangle.
Make a sufficient number of triangles congruent to the unit triangle using coloured paper.
Arrange and paste these triangles on the cardboard as shown in Fig. 2 and Fig. 3.
Demonstration:
ΔABC and ΔPQR are similar. Side BC of ΔABC = (x + x + x + x) units = 4x units
Side QR of DPQR = 5x units
The ratio of the corresponding sides of ΔABC and ΔPQR is
BC/QR = 4x/5x = ⅘
Area of ΔABC = 16 unit triangles
Area of ΔPQR = 25 unit triangles
The ratio of the areas of ΔABC and ΔPQR = 16/12 = 42/52 = Ratios of the square of corresponding sides of ΔABC and ΔPQR.
Observation
By actual measurement:
x = ______. Area of the unit triangle [equilateral triangle in Fig. 1] =_____
Area of ΔABC = ______, Area of ΔPQR = ______
Side BC of ΔABC = ______, Side QR of ΔPQR = ______
BC2 = ___________, QR2 = ___________,
AB = ___________, AC = ___________,
PQ = ___________, PR = ___________,
AB2 = ___________, AC2 = ___________,
PQ2 = ___________, PR2 = ___________,
BC2/QR2 = ___________, Area of ΔABC / Area of ΔPQR = ___________
Area of ΔABC / Area of ΔPQR = BC2/–
= (AB/– )2=(–/PR )2
Application:
This result can be used for similar figures other than triangles also, which in turn helps in preparing maps for plots etc.
Note:
This activity can be performed by taking any triangle as a unit triangle.
To draw a quadrilateral similar to a given quadrilateral as per a given scale factor (less than 1).
Objective: To draw a quadrilateral identical to a given quadrilateral as per a given scale factor (less than 1).
Material Required: Chart paper (coloured and white), geometry box, cutter, eraser, drawing pins, glue, pins, sketch pens, and tape.
Method of Construction:
Take a cut-out of the given quadrilateral ABCD from a coloured chart paper and paste it on another chart paper [see Fig. 1].
Divide the base (here AB) of the quadrilateral ABCD internally in the ratio (given by scale factor) at P [see Fig. 2].
With the help of ruler (scale), join the diagonal AC of the quadrilateral ABCD.
From P, draw a line-segment PQ||BC, with the help of compasses (set squares or paper folding) meeting AC at R [see Fig. 3].
From R, draw a line-segment RS parallel to CD using pair of compasses (set-squares/paper folding) meeting AD in S [see Fig. 4].
Colour the quadrilateral APRS using a sketch pen.
APRS is the required quadrilateral, similar to the given quadrilateral ABCD for the given scale factor [see Fig. 5].
Demonstration
In DABC, PR||BC. Therefore, ΔAPR ~ ΔABC
In DACD, RS||CD. Therefore, ΔARS ~ ΔACD
From Steps (1) and (2), quadrilateral APRS ~ quadrilateral ABCD
This activity can be used daily to make pictures (photographs) of the same object in different sizes.
To verify Pythagoras Theorem.
Objective: To verify Pythagoras Theorem.
Material Required: Chart paper, glazed papers of different colours, geometry box, scissors, adhesive.
Method of Construction:
Take a glazed paper and draw a right-angled triangle whose base is ‘b’ units and perpendicular is ‘a’ units as shown in Fig. 1.
Take another glazed paper and draw a right-angled triangle whose base is ‘a’ units and perpendicular is ‘b’ units as shown in Fig. 2.
Cut out the two triangles and paste them on a chart paper in such a way that the bases of the two triangles make a straight line as shown in Fig. 3. Name the triangles as shown in the figure.
Join CD.
ABCD is a trapezium.
The trapezium is divided into three triangles: APD, PBC and PCD.
Demonstration
ΔDPC is right-angled at P.
Area of ΔAPD = ½ ba sq. units.
Area of ΔPBC = ½ ab sq. units.Area of ΔPCD = ½ c2 sq. units.
Area of the trapezium ABCD = ar(ΔAPD) + ar(ΔPBC) + ar(ΔPCD)
So, ½ (a + b) (a + b) = (½ ab) + (½ ab) + ½ c2i.e., (a+b)2 = (ab + ab + c2)
i.e., a2 + b2 + 2ab= (ab + ab + c2)
i.e., a2 + b2 = c2
Hence, Pythagoras' theorem is verified.
Observation
By actual measurement:
AP = _______, AD = _______, DP = _______,
BP = _______, BC = _______, PC = _______,
AD2 + AP2 = _______, DP2 = _______,
BP2 + BC2 = _______, PC2 = _______,
Thus, a2 + b2 = _______
Application
Whenever two, out of the three sides, of a right triangle are given, the third side can be found by using Pythagoras theorem.
To verify Pythagoras theorem by the Bhaskara method.
Objective: To verify Pythagoras theorem by Bhaskara method.
Material Required: CChart papers of different colours, glazed papers, geometry box, scissors, and adhesive.
Method of Construction:
Take a chart paper and draw a right-angled triangle whose sides are a, b and c units, as shown in Fig. 1.
Make three replicas of the triangle from different coloured chart papers.
Paste all four triangles to make a square as shown in Fig. 2.
Name the square as PQRS whose side is c units.
A square ABCD of side (a – b) units is formed inside the square PQRS. The area of the square PQRS is equal to the area of a square of side (a – b) units added to the areas of four identical right-angled triangles of sides a, b and c units.
Demonstration
Area of one right-angled triangle = ½ ab sq. units
Area of four right-angled triangles = 4 x ½ ab sq. units = 2ab sq. units.Area of the square of side (a – b) units = (a – b)2 sq. units = (a2 – 2ab + b2) sq. units.
Area of the square PQRS of side c units = c2 sq. units.
Take a coloured chart paper of a convenient size and draw a circle of a suitable radius on it. Cut out this circle and paste it on cardboard.
Take points P, Q and R on the circle [see Fig. 1].
Through the points P, Q and R form some creases and select those which touch the circle. These creases will be tangents to the circle.
Let the creases intersect at points A, B and C forming a ΔABC ( creases have been shown by dotted lines)
The circle now can be taken as an incircle of DABC with O as its centre. Join OP, OQ and OR.
Take points P1 and P2 on the crease BC.
Demonstration
Take triangles POP1 and POP2
Clearly OP1 > OP, OP2 > OP.
OP is less than any other line segment joining O to any point on BC other than P, i.e., OP is the shortest of all these.
Therefore, OP⊥ BC.
Hence, tangent to the circle at a point is perpendicular to the radius through that point.
Similarly, it can be shown that OQ ⊥ AC and OR⊥AB.
Observation
By actual measurement:
OP = .............., OQ =.............., OR = ..............
OP1 = .............., OP2 =..............
OP < OP1, OP ........... OP2
Therefore, OP ..... BC
Thus, the tangent is .............. to the radius through the point of contact.
Application
This result can be used in proving various other results of geometry.
To find the number of tangents from a point to a circle.
Objective: To find the number of tangents from a point to a circle.
Material Required: Cardboard, geometry box, cutter, different coloured sheets, adhesive.
Method of Construction:
Take a cardboard of a suitable size and paste a coloured sheet on it.
Draw a circle of suitable radius on a coloured sheet and cut it out [see Fig. 1].
Paste the cutout circle on the cardboard.
Take any point P outside (on or inside) the circle and fix a nail on it. [see Fig. 2, Fig. 3 and Fig. 4].
Take a string and tie one end of it at point P and move the other end towards the centre of the circle. Also, move it up and down from the centre such that it may touch the circle. [see Fig. 2, Fig. 3 and Fig. 4].
Demonstration
If point P is outside the circle, there are two tangents PA and PB as shown in Fig. 2.
If the point P is on the circle, there is only one tangent at P [see Fig. 3].
If the point P is inside the circle, there is no tangent at P to the circle. [see Fig. 4].
Observation
In Fig. 2, the number of tangents through P = -------------------.
In Fig. 3, the number of tangents through P = ----------------.
In Fig. 4, the number of tangents through P = ------------------.
Application
This activity is useful in verifying the property that the lengths of the two tangents drawn from an external point are equal.
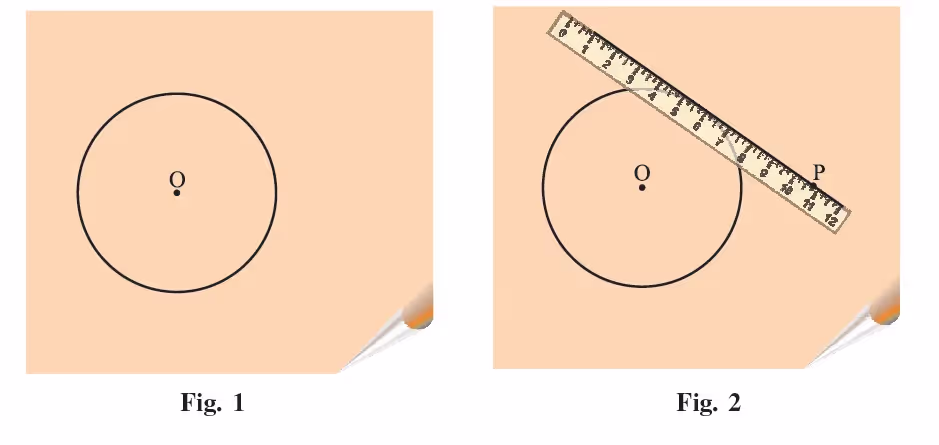
To verify that the lengths of tangents to a circle from some external point are equal.
Objective: To verify that the lengths of tangents to a circle from some external point are equal.
Material Required: Glazed papers of different colours, geometry box, sketch pen, scissors, cutter and glue.
Method of Construction:
Draw a circle of any radius, say a unit, with centre O on a coloured glazed paper of a convenient size [see Fig. 1].
Take any point P outside the circle.
Place a ruler touching the point P and the circle, lift the paper and fold it to create a crease passing through P [see Fig. 2].
Created crease is a tangent to the circle from point P. Mark the point of contact of the tangent and the circle as Q. Join PQ [see Fig. 3].
Now place the ruler touching the point P and the other side of the circle, and fold the paper to create a crease again [see Fig. 4].
This crease is the second tangent to the circle from point P. Mark the point of contact of the tangent and the circle as R. Join PR [see Fig. 5].
Join the centre of the circle O to the point P [see Fig. 6].
Demonstration
Fold the circle along OP.
We observe that Q coincides with R. Therefore, QP = RP, i.e., length of the tangent QP = length of the tangent RP. This verifies the result.
Observation
On actual measurement:
Length of tangent QP = ...............
Length of tangent RP = ...............
So, length of tangent QP = length of tangent .................
Application
This result is useful in solving problems in geometry and mensuration.
To find the height of a building using a clinometer.
Objective: To find the height of a building using a clinometer.
Material Required: Clinometer (a stand fitted with a square plate which is fitted with a movable 0º–360º protractor and a straw), a measuring tape 50 m long, table or stool.
Method of Construction:
Place a table on the ground of a school.
Place a clinometer (a stand fitted with 0º–360º protractor and a straw whose central line coincides with 0º–360º line) on the table.
Now face it towards the building of the school.
Peep out through the straw to the top of the school building and note the angle (q) through which the protractor turns from 0º–360º line.
Measure the height (h) of the centre of the protractor from the ground.
Measure the distance (d) of the building from the point lying on the vertical line of the stand (centre of the protractor) kept on the table [see Fig. 1].
Repeat the above method keeping the clinometer at different positions and collect the values of q, h, and d for different settings.
Demonstration
Using the knowledge of trigonometric ratios, we have :
tan θ = ((H – h)/d), where H is the height of the building.
i.e., H = h + dtanθ
Observation
Application
A clinometer can be used to measure an angle of elevation and an angle of depression.
It can be used in measuring the heights of distant (inaccessible) objects, where it is difficult to measure the height directly.
To obtain formula a for the area of a circle experimentally
Objective: To obtain the formula for the area of a circle experimentally.
Material Required: Threads of different colours, scissors, cardboard, thick sheets of paper, adhesive, ruler.
Method of Construction:
Draw a circle of radius say r units on a thick sheet of paper, cut it out and paste it on the cardboard.
Cut the coloured threads of different sizes in pairs.
Fill up the circle by pasting one set of coloured threads of different sizes in concentric patterns so that there is no gap left between the threads as shown in Fig. 1.
Arrange the other set of coloured threads starting from the smallest to the largest in the pattern shown in Fig. 2. The Last thread will be of the same colour and same length as that of the outermost thread of the circle as shown in Fig. 2.
Demonstration
The number and size of threads pasted on the circle and the number and size of threads pasted in the form of the triangle are the same.
Therefore, the area covered by threads on the circle and the area of the triangular-shaped figure formed by threads are the same.
Area of triangle= ½ Base × Height
The base of the triangle is equal to the circumference of the circle (2πr) and height of the triangle is equal to the radius of the circle, i.e., r.
Area of the circle = Area of triangle = ½ x 2πr x r = πr2
Observation
On actual measurement:
The base of the triangle = ------- units.
Height of triangle = ------- units (i.e., radius of the circle).
Area of triangle = ½ (Base × Height) sq. units.
Area of circle = Area of triangle = -------------------.
Application
This result can be used in finding areas of flower beds of circular and semi-circular shapes and also for making circular designs and in estimating the number of circular tiles required to cover a floor.
Note
The thinner the thread, the more accuracy. Fig. 2 is not drawn to scale.
Take an acrylic sheet of a convenient size and cut out a circle of suitable radius from it [see Fig.1].
Cut out a sector of, say 120º angle, from the circle [see Fig.2].
Make a cone from this sector by joining the two ends along the radii of the sector as shown in Fig. 3.
Cut off a smaller cone from this cone such that the base of the smaller cone is parallel to that of the original cone [see Fig. 4].
The remaining solid is shown in Fig. 5.
Demonstration
The solid shown in Fig. 5 is called the frustum of a cone. Its base and top are two circles of different radii. The height of this frustum is the length of the line segment joining the centres of circles at the top and bottom. Slant height of the frustum is the difference of the slant height of the original cone and the slant height of the cut off cone.
Observation
On actual measurement:
Radius of the base of the frustum = ___________
Radius of the top of the frustum = ___________
Slant height of the original cone = ___________
Slant height of the cut off cone = ___________
Slant height of the frustum = ___________
Height of the original cone = ___________
Height of the cut-off cone = ___________
Height of the frustum = ___________
Height of the frustum = Difference of the heights of two ___________.
The slant height of the frustum = Difference of the slant heights of two _______.
Application
This activity may be used to explain the concepts related to a frustum of a cone.
Frustum-like shapes are very much in use in daily life such as buckets, tumblers, lamp shades, etc.
Note
An alternative method to form a frustumDraw two concentric circles of radii r1 and r2 (r1> r2) on an acrylic sheet. Mark a sector of the bigger circle and cut out the shaded region [see Fig. 6]. Now fold it and form a frustum of a cone.
To obtain formulae for the surface area and the volume of a frustum of a cone.
Objective: To obtain formulae for the surface area and the volume of a frustum of a cone.
Make a frustum of a cone by cutting a smaller cone from a bigger cone using an acrylic sheet as explained in Activity 27 [see Fig. 1 and Fig. 2].
Name the radii of the bigger cone and smaller cone as r1 and r2, respectively, slant heights of the bigger cone and smaller cone as l1 and l2, respectively and heights as h1 and h2, respectively.
Demonstration
Surface Area:
(i) Curved surface area of the frustum
= Curved surface of the bigger cone – Curved surface of the cut-off cone
= πr1l1 – πr2l2
(ii) Total surface area = πr1l1 – πr2l2 + areas of the top and base = πr1l1 – πr2l2 + πr22 + πr12
Volume: Volume of the frustum = Volume of the bigger cone – Volume of the cut off-cone
= ⅓πr12h1 - ⅓πr22h2
Observation
On actual measurement:
r1 = __________, r2= ____________
h1 = __________, h2 = ____________
l1 = __________, l2= ____________
The curved surface area of the frustum = ______________________.
The total surface area of the frustum = ________________________.
Volume of the frustum = ________________________
Application
These results may be used in finding the material required in making containers/ objects in the shape of a frustum of a cone and also to find their capacities.
The free hand curve obtained by joining the points A, B, C, D and E is ____________ type _____________
Application
This ogive can be used to find the median of the data.
To draw a cumulative frequency curve (or an ogive) of more than type.
Objective: To draw a cumulative frequency curve (or an ogive) of more than one type.
Material Required: Coloured chart paper, ruler, squared paper, sketch pens, cellotape, cutter, and adhesive.
Method of Construction:
Collect data on the heights of students in your school and make a frequency distribution table as given below :
Form a cumulative frequency table of more than one type from the above data as given below:
Take a squared paper of size 15 cm × 15 cm and paste it on a coloured chart paper.
Take two perpendicular lines OX and OY on the squared paper and graduate them with divisions as needed by the data.
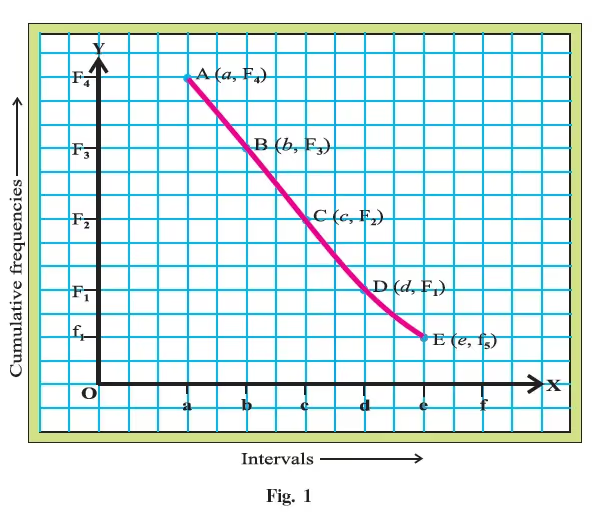
On the squared paper, plot the points A (a, F4), B (b, F3), C (c, F2), D (d, F1) and E (e, f1).
Join the plotted points by a free-hand curve using a sketch pen, as shown in Fig. 1.
Demonstration
The curve in Fig. 1 is a falling curve with cumulative frequencies falling from higher to lower frequencies. This is called a cumulative frequency curve or an ogive of “more than type”.
f5 = __________, F1 = __________, F2 = __________,
F3 = __________, F4 = __________
Coordinates of point A = ____________________
Coordinates of point B = ____________________
Coordinates of point C = ____________________
Coordinates of point D = ____________________
Coordinates of point E = ____________________
The freehand curve obtained by joining the points A, B, C, D and E is ________ type _______
Application
On the same squared paper, if for a given frequency distribution, “less than type ogive” and “more than type ogive” are drawn, then the x-coordinate of the point of the intersection of these ogives will give the “median” of the data.
To determine the experimental probability of 1, 2, 3, 4, 5 or 6 by throwing a die 500 times and comparing them with their theoretical probabilities.
Objective: To determine the experimental probability of 1, 2, 3, 4, 5 or 6 by throwing a die 500 times and comparing them with their theoretical probabilities.
Material Required: A fair die, pen, sheets of white paper.
Method of Construction:
Divide the students of the class into ten groups of suitable size: I, II, III, IV, V, VI, VIII, VIII, IX and X.
Each group will throw a die 50 times and observe the occurrence of each 1, 2, 3, 4, 5 and 6.
Count the number of times (frequency) 1 in each group and denote it by a1, a2, a3,...., and a10, respectively.
Calculate the experimental probability of 1 appearing in each group as a1/50, a2/50,a3/50,...., and a10/50.
Calculate the experimental probability of 1 based on the data of 1st group, 1st two groups, ....., all ten groups as a1/50, (a1+a2)/100,(a1+a2+a3)/150,...., and (a1+a2+a3+......+a10/500.
Similarly, calculate the experimental probability of 2 based on the data of 1st group, 1st two groups, ......., all the ten groups as b1/50,(b1+b2)/100,(b1+b2+b3)/150,...., (b1+b2+....+b10)/500.
Proceed in the same way for getting experimental probabilities for 3, 4, 5 and 6.
Demonstration
The probabilities a1/50, (a1+a2)/100,(a1+a2+a3)/150,...., and (a1+a2+a3+......+a10)/500 are coming closer to ⅙ and the last probability (a1+a2+a3+......+a10)/500 is closest to ⅙ .Same will be the case for b1/50,(b1+b2)/100,(b1+b2+b3)/150,...., (b1+b2+....+b10)/500and so on.
The theoretical probability P(E) of an event E (say 1) = P(1)
= (Number of outcomes favourable to E)/(Number of all possible outcomes of the experiment)= 1/6Similarly, P (2) = P (3) = P (4) = P (5) = P (6) = 1/6From Steps (1) and (2), it can be seen that the experimental probability of each number 1, 2, 3, 4, 5 and 6 is very close to the theoretical probability ⅙.
Experimental probability of 1 is nearly equal to theoretical ________.
Experimental probability of 2 is ________ to theoretical _________.
Experimental probability of 6 is _____ to _______ probability.
Application
Probability is used extensively in fields like physical sciences, commerce, biological sciences, medical sciences, weather forecasting, etc.
To determine the experimental probability of a head (or a tail) by tossing a coin 1000 times and comparing it with its theoretical probability.
Objective: To determine experimental probability of a head (or a tail) by tossing a coin 1000 times and compare it with its theoretical probability.
Material Required: A fair die, pen, sheets of white paper.
Method of Construction:
Divide the students of the class into 10 groups I, II, III, ..., X.
Each group will toss a coin 100 times and will observe the occurrence of a head.
Count the total number of times (frequency) a head comes up in each group and denote these by a1, a2, ..., and a10, respectively.
Calculate the experimental probability of a head in each group as a1/100, a2/100,...,a10/100
Calculate the experimental probabilities of a head based on the data of 1st group, 1st two groups, ..., all ten groups as a1/100, a1+a2/200,..., a1+a2+...+a10/1000, respectively.
Demonstration
The probabilitiesa1/100, a1+a2/200,..., a1+a2+...+a10/1000 are coming closer and closer to ½.
The theoretical probability of an event E (a head) = P (H).
= (Number of outcomes favourable to E)/(Number of all possible outcomes of the experiment)
= 1/2
From Steps 1 and 2, it can be seen that the experimental probability of a head is very close to the theoretical probability.
Observation
Each group will complete the following table :
Experimental probability of a head = − − −/1000
Experimental probability of a head is nearly equal to theoretical _______
_______ probability of a head is nearly _____ to theoretical ________
Application
Probability is used extensively in the fields like physical sciences, commerce, biological sciences, medical sciences, weather forecasting, etc.
Note
Similar activity can be performed for the occurrence of a tail.
CBSE Lab Manual Class 10th Maths - Marks Breakdown
In the board examinations, students must perform at least two activities in the given time. The two mathematics teachers are usually responsible for the exam conduction. The marks breakdown for the Class 10 Lab Manual is as mentioned.
Statement of the objective of the activity: 1 mark
Material required: 1 mark
Preparation for the activity: 3 marks
Conduct of the activity: 3 marks
Observation and analysis: 3 marks
Results and conclusion: 1 mark
The viva voce for three marks constitutes 3 marks in the final board examination.
CBSE Class 10 Maths Lab Manual - Important Features
The lab manual in the CBSE Class 10 Maths Syllabus constitutes the practical manual lab activities with the viva voce and mental Maths.
Every maths lab activity solution constitutes objective, material required, theory, procedure, demonstration, observation, result, learning outcomes, and theoretical applications.
The added viva voce helps in concept clarity with activity-based questions.
With mental maths, students can apply what they have learnt to different questions.
The listed activities are self-explanatory and well-illustrated.
The stepwise procedure helps in performing the activity effectively.
The theoretical applications will tell where to apply the acquired knowledge.
CBSE Class 10 Maths Activities - Tips & Tricks
Performing an activity sounds interesting, but missing a step can actually result in losing the marks. A few tips and tricks can help avoid this.
Use sharpened pencils, wherever necessary.
Marking the scale of the graph is necessary to avoid mark deduction.
Start with understanding the theory before experimenting.
Double-check the calculation since this is where the majority makes the mistake.
Project Idea- Video 1
Project Idea- Video 2
Project Idea- Video 3
Project Idea- Video 4
CBSE Project Work for Class 10 Maths
The acquired knowledge is tested at year end via examination, lab activities, and project work. The students are expected to do at least one project work based on the concepts they have learnt throughout the session. The project work can be done in a group or individually. Here is the list of some suggested project work and group activities for CBSE Class 10 students.
Project 1: Chronological development of solution of quadratic equations
Project 2: Sum of the exterior angles of a polygon taken in an order
Project 3: To Prepare a list of quotations on Mathematics
Project 4: Ramanujan Number (1729)
Project 5: Application of Geometry in day-to-day life
This lab manual and group project are part of the CBSE Class 10 internal evaluation and can help students score at least 20 marks in the examination. To understand how to perform the activities and projects, students can refer to the Educart Lab Manual of class 10 maths book and online solutions.

.svg)